Posts Tagged ‘State of northern VA housing market

27
Apr
15

State of the Great Falls, VA 22066 Housing Market – Quarter End 3/31/15

There is a popular saying among top economists: “As goes housing, so goes the economy.”

Normally, nationwide housing and housing-related services account for about 15-19% of the Gross Domestic Product (GDP), depending on the year. However, broad generalizations such as: “It’s a great time to buy,” don’t even begin to tell the whole story, particularly in Northern Virginia. In order to fully understand our local housing market, the statistics need to be broken down into meaningful components which can be understood and applied by the average home owner and potential buyer.

This analysis provides a snapshot in time of our constantly changing local real estate market. Hopefully, it will provide you with a more detailed and accurate picture of what is happening in our market today.

State of the Great Falls, VA 22066 Housing Market – Quarter End 3/31/15

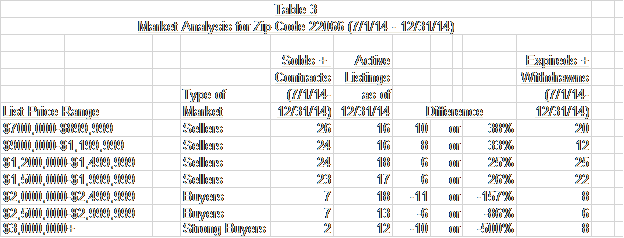
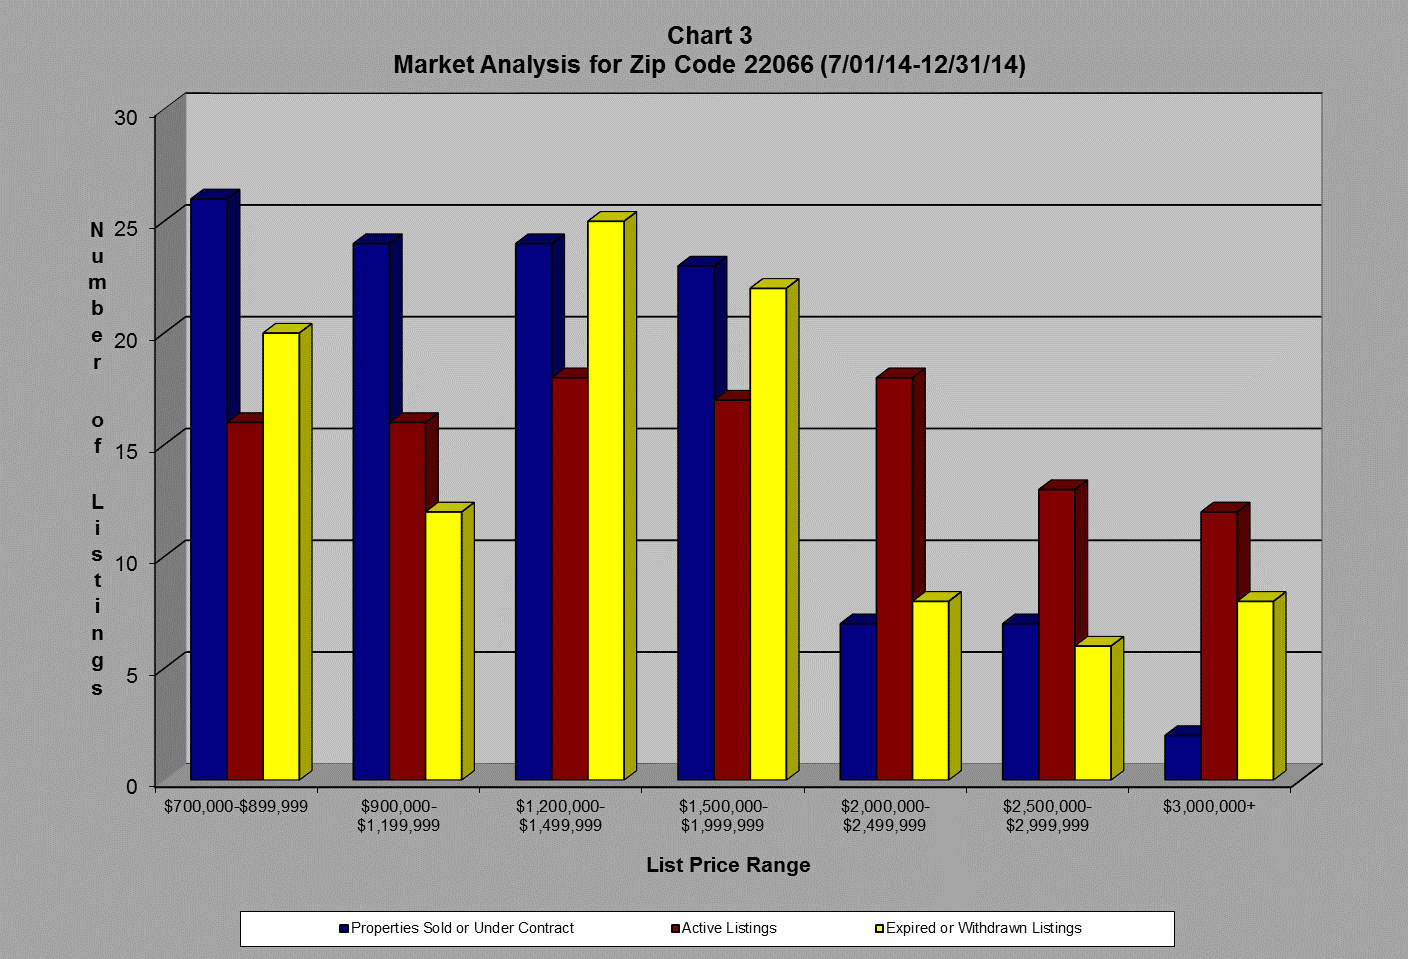
The following table and chart compare the number of homes for sale (the supply) to the number of homes sold or under contract (the demand) in the local real estate markets of Great Falls (zip code 22066) by price range for the time period from 7/1/14 – 3/31/15.  The following chart depicts the relationship between supply, demand and price.

supply and demand chart

Based on the current data, the real estate market in our area can be characterized in one of three ways:

Buyers’ Market – More Homes for Sale (Supply) than Homes Sold and Under Contract (Demand)

Balanced Market – An Equal Number of Homes for Sale (Supply) as compared to Homes Sold and Under Contract (Demand)

Sellers’ Market – More Homes Sold and Under Contract (Demand) than Homes for Sale (Supply)

22066 chart 033115

22066 table 033115

$700,000 – $899,999SELLERS’ MARKET.  The number of homes sold in this price range, including those under contract, is 24% more than the number listed for sale.  If the 11 homes withdrawn from the market and those with expired listings went back on the market, this price range shifts to a balanced market.

$900,000 – 1,199,999 BALANCED MARKET.  The number of homes sold in this price range, including those under contract, is equal to the number listed for sale.  If you factor in the 12 properties withdrawn from the market and listings that expired, this price range shifts to a buyers’ market.

$1,200,000 – $1,499,999BALANCED MARKET.  The number of homes sold in this price range, including those under contract, is almost equal to than the number listed for sale.  If you factor in the 12 homes withdrawn from the market and listings that expired, this price range shifts to a buyers’ market.

$1,500,000 – $1,999,999BUYERS’ MARKET.  There are fifteen more homes listed for sale in this price range compared to the number actually sold, including those under contract.  If you factor in the 9 properties withdrawn from the market and listings that expired, the number for sale is 1½ times the number sold or under contract, and this price range becomes a stronger buyers’ market.

$2,000,000 – $2,499,999BUYER’S MARKET.  The number of homes listed for sale in this price range is more than 3 times the number sold, including those under contract.  If you factor in the 8 properties withdrawn from the market and listings that expired, the number for sale is 5 times the number sold or under contract, and this price range becomes a strong buyers’ market.

$2,500,000 – 2,999,999 BUYER’S MARKET.  The number of homes listed for sale in this price range is more than twice the number sold, including those under contract.  If you factor in the six homes withdrawn from the market and listings that expired, the number for sale is more than 3 times the number sold or under contract, and this price range becomes a strong buyers’ market.

$3,000,000 and upSTRONG BUYER’S MARKET.  The number of homes listed for sale in this price range is seventeen times the number sold, including those under contract.  If you factor in the nine homes withdrawn from the market and listings that expired, the number for sale is 26 times the number sold in this price range or under contract, and this price range becomes an even stronger buyers’ market.

For more information on the Great Falls real estate market or to buy or sell a home in Great Falls, please contact Tania Hosmer at TaniaHosmer@gmail.com or (703) 403-8225.

Advertisement
25
Jan
15

State of the Great Falls VA 22066 Housing Market — Quarter End 12/31/14 — Table

State of the Great Falls VA 22066 Housing Market — Quarter End 12/31/14 — Table

table 3 in grey

Note: All of the numbers for the withdrawn and expired listings were cross referenced against currently active listings, sold listings and under contract listings.  If they were listed in another category, they were excluded from the numbers and thus not accounted for more than once.

For more information on the Great Falls real estate market, please contact Tania Hosmer at TaniaHosmer@gmail.com or (703) 403-8225.

25
Jan
15

State of the Great Falls, VA 22066 Housing Market — Quarter End 12/31/14 — Text Summary

State of the Great Falls, VA 22066 Housing Market — Quarter End 12/31/14 — Text Summary

  •  $700,000 – $899,999Sellers’ Market. The number of homes that sold between 7/1/14 and 12/31/14 plus the number of homes currently under contract is more than 1½ times the number of homes currently listed for sale. If the 20 homes that were withdrawn from the market or expired went back on the market for sale, this price range would shift to a buyers’ market.
  • $900,000 – $1,199,999Sellers’ Market. The number of homes that sold between 7/1/14 and 12/31/14 plus the number of homes currently under contract is 1½ times the number of homes currently listed for sale.  If you factor in the 12 properties that were withdrawn and listings that expired, this price range would shift to a buyers’ market.
  • $1,200,000 – $1,499,999Sellers’ Market. The number of homes sold between 7/1/14 and 12/31/14 plus the number of properties currently under contract is 25% more than the number of homes currently listed for sale. If you factor in the 25 homes that were withdrawn from the market and the listings that expired, this price range would shift from a sellers’ market to a buyers’ market.
  • $1,500,000 – $1,999,999 Sellers’ Market. There are 6 fewer homes that are currently listed for sale than the number of properties sold between 7/1/14 and 12/31/14 plus the number of homes currently under contract. If you factor in the 22 properties that expired or were withdrawn from the market, the number of homes for sale would be more than 1½ times the number of homes sold plus under contract homes and this price range would become a buyers’ market.
  • $2,000,000 – $2,499,999Buyers’ Market. The number of homes currently listed for sale is more than 2 ½ times the number of properties sold between 7/1/14 and 12/31/14 plus the number of homes currently under contract. If you factor in the 8 homes that were withdrawn from the market and the homes that expired, the number of homes for sale would be more than 3 ½ times the number of sold plus under contract homes and this price range would become a stronger buyers’ market.
  • $2,500,000 – $2,999,999Buyers’ Market. The number homes currently listed for sale is almost 2 times the number of properties sold between 7/1/14 and 12/31/14 plus the number of homes currently under contract. If you factor in the 6 homes that were withdrawn from the market and the homes that expired, the number of homes for sale would be more than 2 ½ times the number of sold plus under contract homes and this price range would become a stronger buyers’ market.
  • $3,000,000 and upStrong Buyers’ Market. The number of homes currently listed for sale is 6 times the number of homes sold between 7/1/14 and 12/31/14 plus the number of homes currently under contract. If you factor in the 8 homes that were withdrawn from the market and the homes that expired, the number of homes for sale would be 10 times the number of sold plus under contract homes and this price range would become an even stronger buyers’ market.

Note: All of the numbers for the withdrawn and expired listings were cross referenced against currently active listings, sold listings and under contract listings.  If they were listed in another category, they were excluded from the numbers and thus not accounted for more than once.

For more information on the Great Falls real estate market, please contact Tania Hosmer at TaniaHosmer@gmail.com or (703) 403-8225.


22
Jan
15

State of the Great Falls, VA 22066 Housing Market — Quarter End 12/31/14 — Chart

State of the Great Falls, VA 22066 Housing Market — Quarter End 12/31/14 — Chart

great falls chart

Note: All of the numbers for the withdrawn and expired listings were cross referenced against currently active listings, sold listings and under contract listings.  If they were listed in another category, they were excluded from the numbers and thus not accounted for more than once.

For more information on the Great Falls real estate market, please contact Tania Hosmer at TaniaHosmer@gmail.com or (703) 403-8225.

21
Nov
12

October Market Statistics for Great Falls, VA 22066

October Market Statistics for Great Falls, Virginia 22066

Statistic Values YoY MoM
Total Sold Dollar Volume $18,846,000 +9.74% +0.32%
Closed Sales 14 +7.69% -12.5%
Median Sold Price $1,160,000 +5.45% +17.02%
Average Sold Price $1,346,143 +1.9% +14.65%
Average Days on Market 111 days -22.92% +7.77%
Average Sold to Original List Ratio 91.17% +2.07% -4.11%


Inventory      
  October 2012 October 2011 % Change
Active Listings 154 142 8.45%
New Listings 28 24 16.67%
New Under Contracts 2 4 -50.00%
New Contingents 12 13 -7.69%
New Pendings 14 17 -17.65%
All Pendings 31 36 -13.89%


For more information regarding the Great Falls, Virginia real estate market, please contact Tania Hosmer at TaniaHosmer@gmail.com or (703) 403-8225


07
Nov
12

State of the Great Falls, VA 22066 Housing Market – Quarter End 9/30/12

There is a popular saying among top economists: “As goes housing, so goes the economy.”

Normally, nationwide housing and housing-related services account for about 15-19% of the Gross Domestic Product (GDP), depending on the year. However, broad generalizations such as: “It’s a great time to buy,” don’t even begin to tell the whole story, particularly in Northern Virginia. In order to fully understand our local housing market, the statistics need to be broken down into meaningful components which can be understood and applied by the average home owner and potential buyer.

This analysis provides a snapshot in time of our constantly changing local real estate market. Hopefully, it will provide you with a more detailed and accurate picture of what is happening in our market today.

Based on the current data, the real estate markets in our area can be characterized in one of three ways:

Buyers’ Market – More Active Listings (Supply) than Sold and Under Contract Listings (Demand)

Balanced Market – An Equal Number of Active Listings (Supply) as compared to Sold and Under Contract Listings (Demand)

Sellers’ Market – More Sold and Under Contract Listings (Demand) than Active Listings (Supply)

Table 3
Market Analysis for Zip Code 22066 (4/1/12 – 9/30/12)
Solds + Expireds +
Contracts Withdrawns
Type of (4/1/12- Active (4/1/12-
List Price Range Market 9/30/12) Listings Difference 9/30/12)
$700,000-$899,999 Sellers’ 32 25 7 or 21.88% 10
$900,000-$1,199,999 Sellers’ 38 25 13 or 34.21% 10
$1,200,000-$1,499,999 Sellers’ 28 15 13 or 46.43% 20
$1,500,000-$1,999,999 Buyers’ 17 24 -7 or -41.18% 1
$2,000,000-$2,499,999 Buyers’ 8 10 -2 or -25.00% 7
$2,500,000-$2,999,999 Buyers’ 7 15 -8 or -114.29% 4
$3,000,000+ Strong Buyers’ 4 27 -23 or -575.00% 10

Summary of Zip Code 22066

$700,000 – $899,999Sellers’ Market. The number of homes that sold between 4/1/12 and 9/30/12 plus the number of homes currently under contract is more than the number of homes currently listed for sale. If you factor in the homes that have been withdrawn from the market or listings allowed to expire, the price range would be close to balanced.

$900,000 – 1,199,999Sellers’ Market. The number of homes that sold between 4/1/12 and 9/30/12 plus the number of homes currently under contract is 1 ½ times the number of homes currently listed for sale. If you factor in the properties that were been withdrawn and listings that expired, this price range would be close to balanced.

$1,200,000 – $1,499,999Sellers’ Market. The number of homes sold between 4/1/12 and 9/30/12 plus the number of properties currently under contract is close to double the number of homes currently listed for sale. If you factor in the 16 homes that were withdrawn from the market and the 4 listings that expired, this price range would shift from a sellers’ market to a buyers’ market.

$1,500,000 – $1,999,999Buyers’ Market. The number of homes that are currently listed for sale is almost 1 ½ times more than the properties sold between 4/1/12 and 9/30/12 plus the number of homes currently under contract. If you factor in the 1 home that was withdrawn from the market, the balance of the market in this price range does not significantly change.

$2,000,000 – $2,499,999Buyers’ Market. The number of homes currently listed for sale is slightly more than the number of properties sold between 4/1/12 and 9/30/12 plus the number of homes currently under contract. If you factor in the homes that were withdrawn from the market and the homes that expired, the number of homes for sale would be more than two times the number of sold plus under contract homes and this price range would be a stronger buyers’ market.

$2,500,000 – $2,999,999Buyers’ Market. The number homes currently listed for sale is more than 2 times the number of properties sold between 4/1/12 and 9/30/12 plus the number of homes currently under contract. If you factor in the homes that were withdrawn from the market and the homes that expired, the number of homes for sale would be 2 ½ times the number of sold plus under contract homes and this price range would be a stronger buyers’ market.

$3,000,000 and upStrong Buyers’ Market. The number of homes currently on the market is close to 7 times the number of homes sold between 4/1/12 and 9/30/12 plus the number of homes currently under contract. If you factor in the homes that were withdrawn from the market and the homes that were allowed to expire, the number of homes for sale would be more than 9 times the number of sold plus under contract homes and this price range would be an even stronger buyers’ market.

For more information on the Great Falls real estate market, please contact Tania Hosmer at TaniaHosmer@gmail.com or (703) 403-8225.

14
Sep
12

August Market Statistics for Great Falls, VA 22066

August Market Statistics for Great Falls, Virginia 22066

Statistic Values YoY MoM
Total Sold Dollar Volume $22,102,000 +22.72% -15.67%
Closed Sales 22 +37.5% -8.33%
Median Sold Price $990,000 +4.62% -1.25%
Average Sold Price $1,004,636 -10.75% -8.01%
Average Days on Market 53 days -60.15% -28.38%
Average Sold to Original List Ratio 93.59% +1.55% -0.75%

Inventory      
  August 2012 August 2011 % Change
Active Listings 153 172 -11.05%
New Listings 23 28 -17.86%
New Under Contracts 3 6 -50.00%
New Contingents 16 18 -11.11%
New Pendings 19 24 -20.83%
All Pendings 39 37 5.41%
14
Sep
12

July Market Statistics for Great Falls, VA 22066

July Market Statistics for Great Falls, Virginia 22066

Inventory
July 2012 July 2011 % Change
Active Listings 167 190 -12.11%
New Listings 28 37 -24.32%
New Under Contracts 10 7 42.86%
New Contingents 15 19 -21.05%
New Pendings 25 26 -3.85%
All Pendings 46 33 39.39%

— 

Sold Summary
July 2012 July 2011 % Change
Sold Dollar Volume $26,209,450 $15,209,000 72.33%
Average Sold Price $1,092,060 $894,647 22.07%
Median Sold Price $1,002,500 $800,000 25.31%
Units Sold 24 17 41.18%
Average Days on the Market 74 79 -6.33%
Average List Price for Solds $1,142,685 $925,171 23.51%
Average SP to OLP Ratio 94.3% 94.7% -0.39%
Ratio of Average SP to Average OLP 93.3% 94.1% -0.84%
Attached Average Sold Price $0 $0 0%
Detached Average Sold Price $1,092,060 $894,647 22.07%
Attached Units Sold $0 $0 0%
Detached Units Sold 24 17 41.18%


“It’s Not Your Father’s Real Estate Market Anymore” ®

Tania grew up in Northern Virginia and is a life long resident of the area. She has lived in the Reserve in McLean, Virginia with her husband and 2 children since 2001. Tania and her husband Jim purchased their lot in Section 1 of the Reserve in June of 1999 and built their home in the following 18 months. She holds a bachelor’s degree in Physics from Mary Washington College and an MBA in Finance from The George Washington University. Tania began her real estate career over 20 years ago. In addition to real estate sales, her experience includes managing residential renovation projects in the greater Washington area, planning and overseeing new residential construction and managing rental properties. After completing her MBA in 1996, she joined CIG International (a Washington-based residential real estate investment firm) as Vice President where she conducted extensive due diligence investigations of real estate investment opportunities and oversaw ongoing investment projects. Tania became a residential real estate agent in 2006.

Tania’s Contact Information:

Tania Hosmer
Keller Williams Realty
6820 Elm Street
McLean, Virginia 22101
cell: 703-403-8225
email: taniahosmer@gmail.com
website: www.taniahosmer.com

Enter your email address to follow this blog and receive notifications of new posts by email.


%d bloggers like this: